Hello there! Welcome to Marked by Teachers
You've found a student & teacher community where we try and help each other by sharing essays and information.

Find an essay now!
Don't delay start searching for essays today!


Learn the essentials
Created by teachers, our study guides highlight the really important stuff you need to know. Find a study guide for your topic
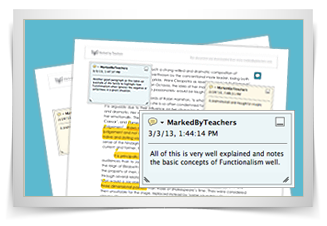
Teacher marked essay examples
Learn from teacher marked essay examples what goes into a great essay and get ideas to write your own. Find an essay now
How to write an essay
Our team of experienced teachers have created the ultimate guide to writing a well-structured essay. Go to our essay writing guide
Search for essay examples by level

Sign-up Now!


Our teachers have been handpicked to provide the very best essay feedback, reviews and advice across all levels and subjects. With almost 700 years of teaching experience between them, they know better tham anyone what goes into an essay that gets the grades.